
Shift 1.0 marks the evolution from Data Navigator to Shift™. This release brings process data from your control system into Shift, adds Microsoft Teams notifications, gives you more precise mission failure alerts and reports, and provides a refreshed asset comparison view. It also includes several inspection and AI improvements.
For more information on all of the new features included in this release, see the Shift User Guide.
Release summary
- DCS/SCADA data: View process signals, such as temperature and pressure, alongside robot inspection data for the same asset.
- Microsoft Teams notifications: Receive Shift notifications in Microsoft Teams.
- Mission task failure notifications and reports: Choose which task failures you’re notified about, and review failure reasons in mission reports.
- Asset comparison improvements: A compact layout, clearer axis labeling, an expanded view, edit options, and page-level time controls.
- Inspection and AI improvements: Thermal alignment, sharper acoustic imaging, more accurate change detection, and the option to disable anomaly verification.
- Environments update: Environments is now disabled by default.
Data Navigator is now Shift™
The Shift name appears in the product interface, notifications, emails, and product documentation. Otherwise, the interface and functionality is unchanged. For now, existing Data Navigator links and bookmarks redirect automatically, but they’re deprecated and will be removed in a future release. Existing deployments continue to run without disruption.
What you might need to do:
- Update bookmarks and shared links to the new Shift address.
- If you sign in using SSO, check that the callback URL points to the new Shift address.
- If you use the API or Python client, note that the API documentation covers both Shift and Data Navigator during the transition. The Python client is being renamed, so plan to update any scripts that reference it by name.
Microsoft Teams notifications
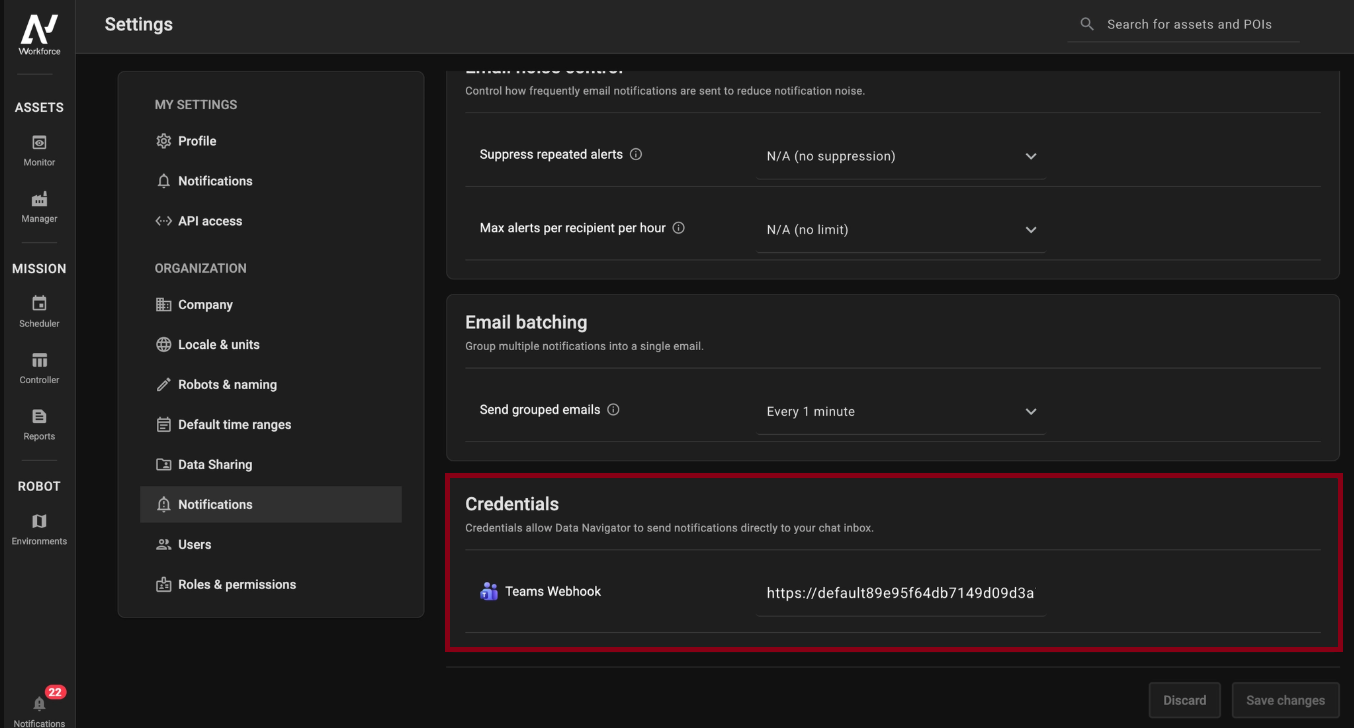
Shift can now send notifications to Microsoft Teams. Your Microsoft 365/Azure administrator installs a Shift notification workflow in Power Automate, and the workflow’s link is then added in the new Credentials section in Shift, under organizational notification settings. Each user can then turn on Teams notifications in their own settings. To get started, contact Customer Success, who will enable the feature and assist your administrator with setup.
DCS/SCADA data
Shift can now bring in process signals from your distributed control system (DCS) or SCADA system, such as temperature or pressure, and show them alongside inspection data for the same asset. This gives you the operating context behind each inspection when you review results.
Process signals appear as points of interest (POIs) on the asset. One POI can contain several metrics, each with its own view that shows values over time. Each view has its own thresholds and alerts, so process data can trigger alerts just as inspections do.
To connect your DCS or SCADA system to Shift, contact Customer Success.
Mission task failure notifications
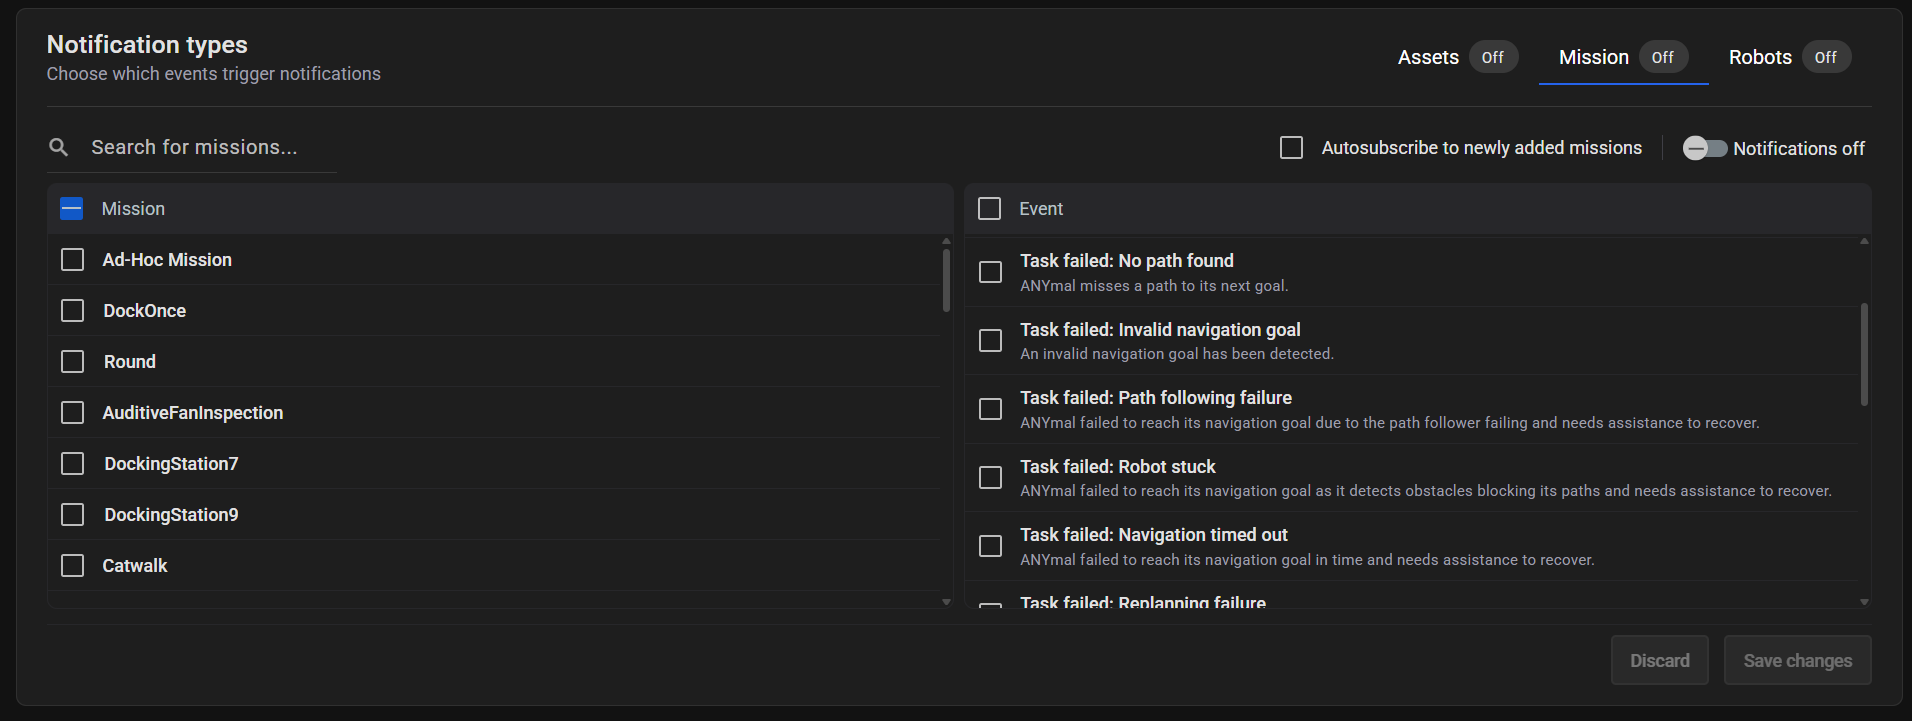
You can now subscribe to notifications about mission task failures and choose which failures you receive notifications about. Examples include localization, replanning, navigation, and docking task failures. To subscribe to and manage mission task failure notifications, go to Settings > Notifications and open the Mission tab in the Notification types section.
Failure reasons in mission reports
Mission reports now include a chronological list of mission and task failure events, each with its time, event type, and description. These are the same events used for notifications, so reports and alerts always describe a failure the same way.
The summary at the top of the report groups repeated failures: if a robot gets stuck and misses many POIs for the same reason, you see that reason once instead of one row per POI.
Asset comparison improvements
Asset comparisons are now more compact, easier to read, and quicker to set up.
- Compact, responsive layout: Comparison cards are now smaller, so you see two to three cards per row on a standard monitor and up to four on larger screens. The layout adapts to your screen width.
- Easier-to-read charts:
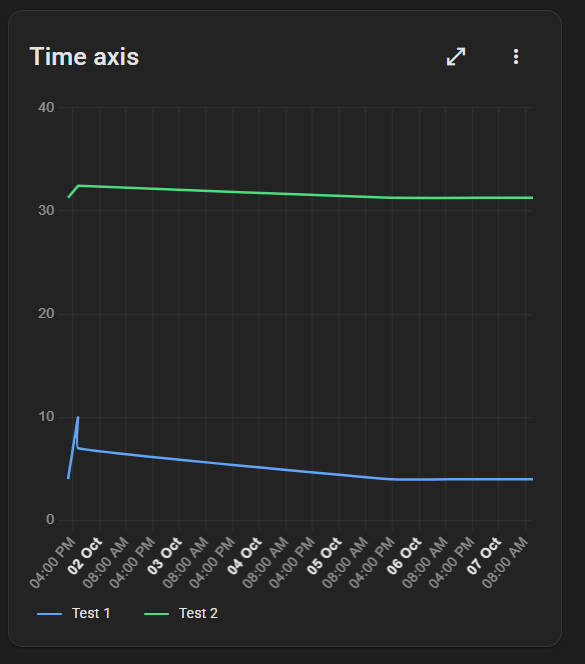
- A legend groups metrics under a left and right axis, so you can see at a glance which scale each value uses.
- When you hover over a data point in a chart, you can now see the POI it comes from.
- Depending on the selected date range, the time axis shows times of day, dates, or both, so you can easily see when a value was measured.
- Expanded view: Open any chart in an expanded view for more room and detail.
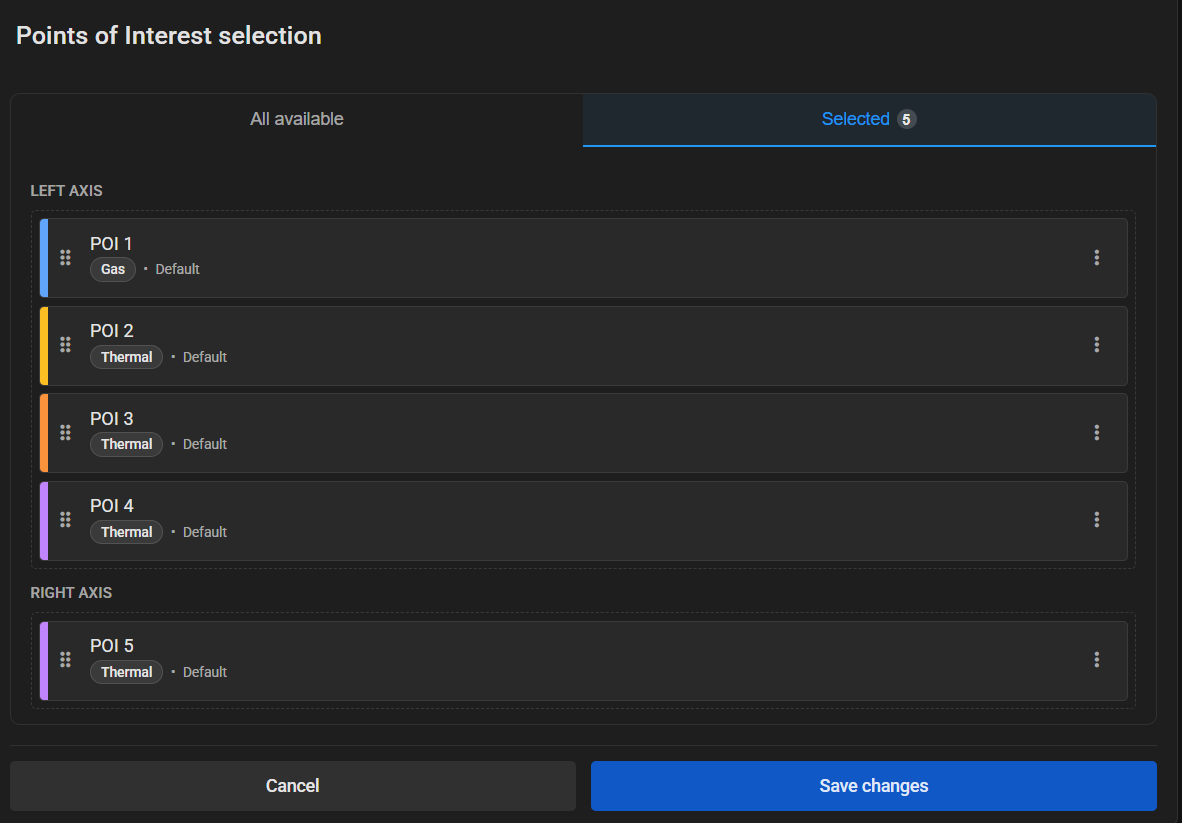
- Edit mode: Assign each POI to the left or right axis, change its color, and change its order in the chart legend.
- Smart defaults:
- When you select an asset, all of its views and POIs are shown automatically.
- Metrics with the same unit share an axis automatically (for example, °C on the left and bar or L/min on the right). You can change this in edit mode.
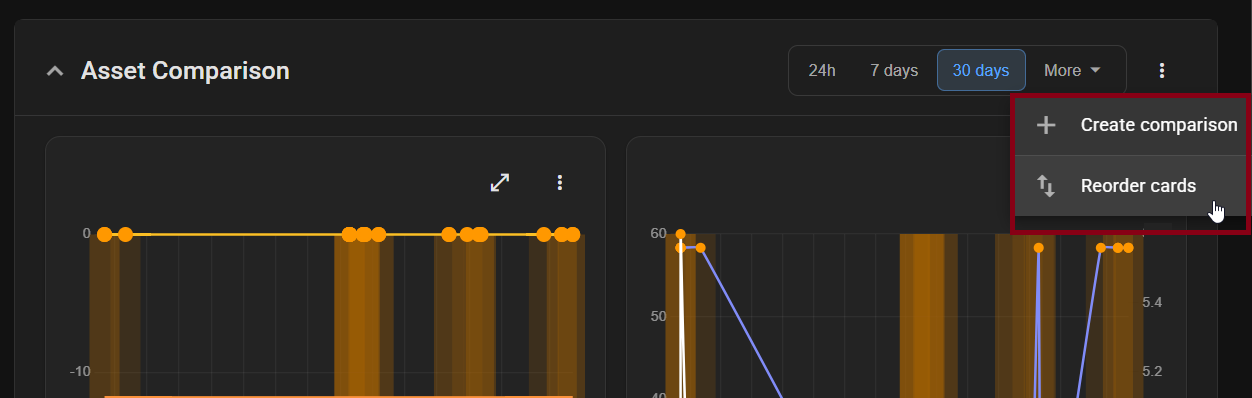
- Page-level controls: A single date range now applies to the whole page instead of each comparison card, and you can rearrange the comparison cards.
Inspection and AI improvements
- Thermal alignment (requires robot software 26.06 or later): Thermal images are now aligned to the reference image used to create the region of interest (ROI). This compensates for small shifts between inspections, so that readings are analyzed more consistently. As a result, ROIs can appear as polygons instead of rectangles. To change the reference image, create a new view based on the previous view.
- Sharper acoustic imaging: Leak detection, partial discharge, and mechanical anomaly inspections now show an averaged sound-analysis image instead of continuous video. This reduces disturbances from low-level background noise, so that real noise sources are easier to see.
- Improved change detection: The AI used for change detection is better at spotting anomalies in context and now names the type of anomaly alongside the numerical score.
- Disable anomaly verification: For Visual Inspection Intelligence (VII) views, you can now turn off anomaly verification. Anomalies are then raised directly from the AI interpretation. To turn it off, open the POI, go to Over time results > Alert Settings, and select Disable anomaly verification.
- Historic jobs: When you add a new view to existing data, the resulting jobs are no longer sent for verification for VII views and show the AI interpretation only.
Changes
Starting with this release, Environments is behind a feature toggle and is disabled by default. To re-enable it, contact Customer Success.
Fixes
- Emails for failed ad-hoc missions now say that the mission failed, instead of “completed” shown in red.
- The asset structure tree on the Assets and Points of Interest pages now shows every asset and POI, even when there are more than 100.