Release 26.04 is now available for Data Navigator! We’ve been hard at work developing new features and enhancements to optimize your ANYmal experience. Here, you’ll find detailed information about what’s new in this release.
New features
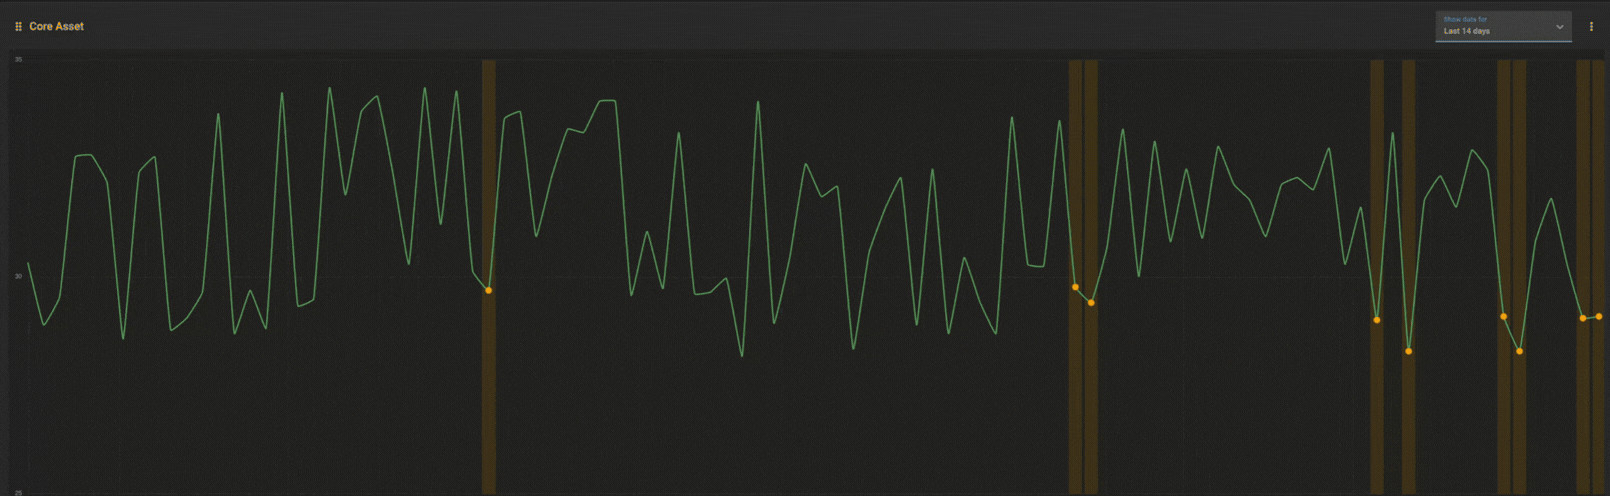
Enhanced trendline visibility
Updated the Asset Comparisons trendline graph so that you can see individual data points for normal inspection results. Previously, trendlines only highlighted anomalies, which made it difficult to see values for normal readings. Now, hovering the cursor over a trendline reveals all normal data points (i.e., inspections) as dots that match the trendline’s color, with tooltips showing the recorded measurements and links to the corresponding inspection. Anomalies are always clearly indicated with orange dots, ensuring that abnormal readings are clearly visible.
Improved thermal color scaling
Updated the color scaling in inspection previews and comparison views for thermal inspections. The color scale now reflects the full temperature range of the entire image, regardless of whether a region of interest is defined.
Loading state indicators
Data Navigator now has loading states to make it clear when content is loading. Placeholders appear while tables, graphs, and images load, and loading indicators are shown after actions like button clicks.
Asset tree improvements
The asset tree is now visible and pinned by default in Asset Manager when you update to this release. Additionally, the asset tree is now opened by hovering the cursor over the Show asset tree icon. This replaces the previous functionality where you hovered the cursor over the Assets Manager icon in the sidebar to open the tree.
Redesigned inspection previews
Inspection previews have been updated to make it easier to interact with and view inspection results. Updates include:
- Consistent layout: There is now a single, consistent layout for all inspection types.
- Image focus: Images are now the main focal point of inspection previews, making it easier to spot issues.
As part of this update, you can now zoom in on thermal and visual inspection images. Hover the cursor over an image to show the zoom controls, and click and drag the image to focus on different areas.
Additional updates
- Updated the Filter assets and Filter robot dialogs so that the dialog heading remains fixed when you scroll through the list of filter options.
- You can now define regions of interest as small as 10 × 10 pixels (previously 50 × 50).
Fixes
- Fixed an issue where the Concentration (ppm) column wasn’t populated in the Inspection history section for gas concentration inspections.
- Fixed an issue where, in some cases, comparison values were calculated incorrectly for regions of interest in thermal POIs.
- Fixed an issue that could occur in the comparison view for thermal and frequency analysis inspections. In some cases, inspection previews didn’t load properly and only a black square appeared.
- Fixed the Search drop-down so that it now correctly displays POI names in the search results.